Data Summary and Quality Check
Quality check
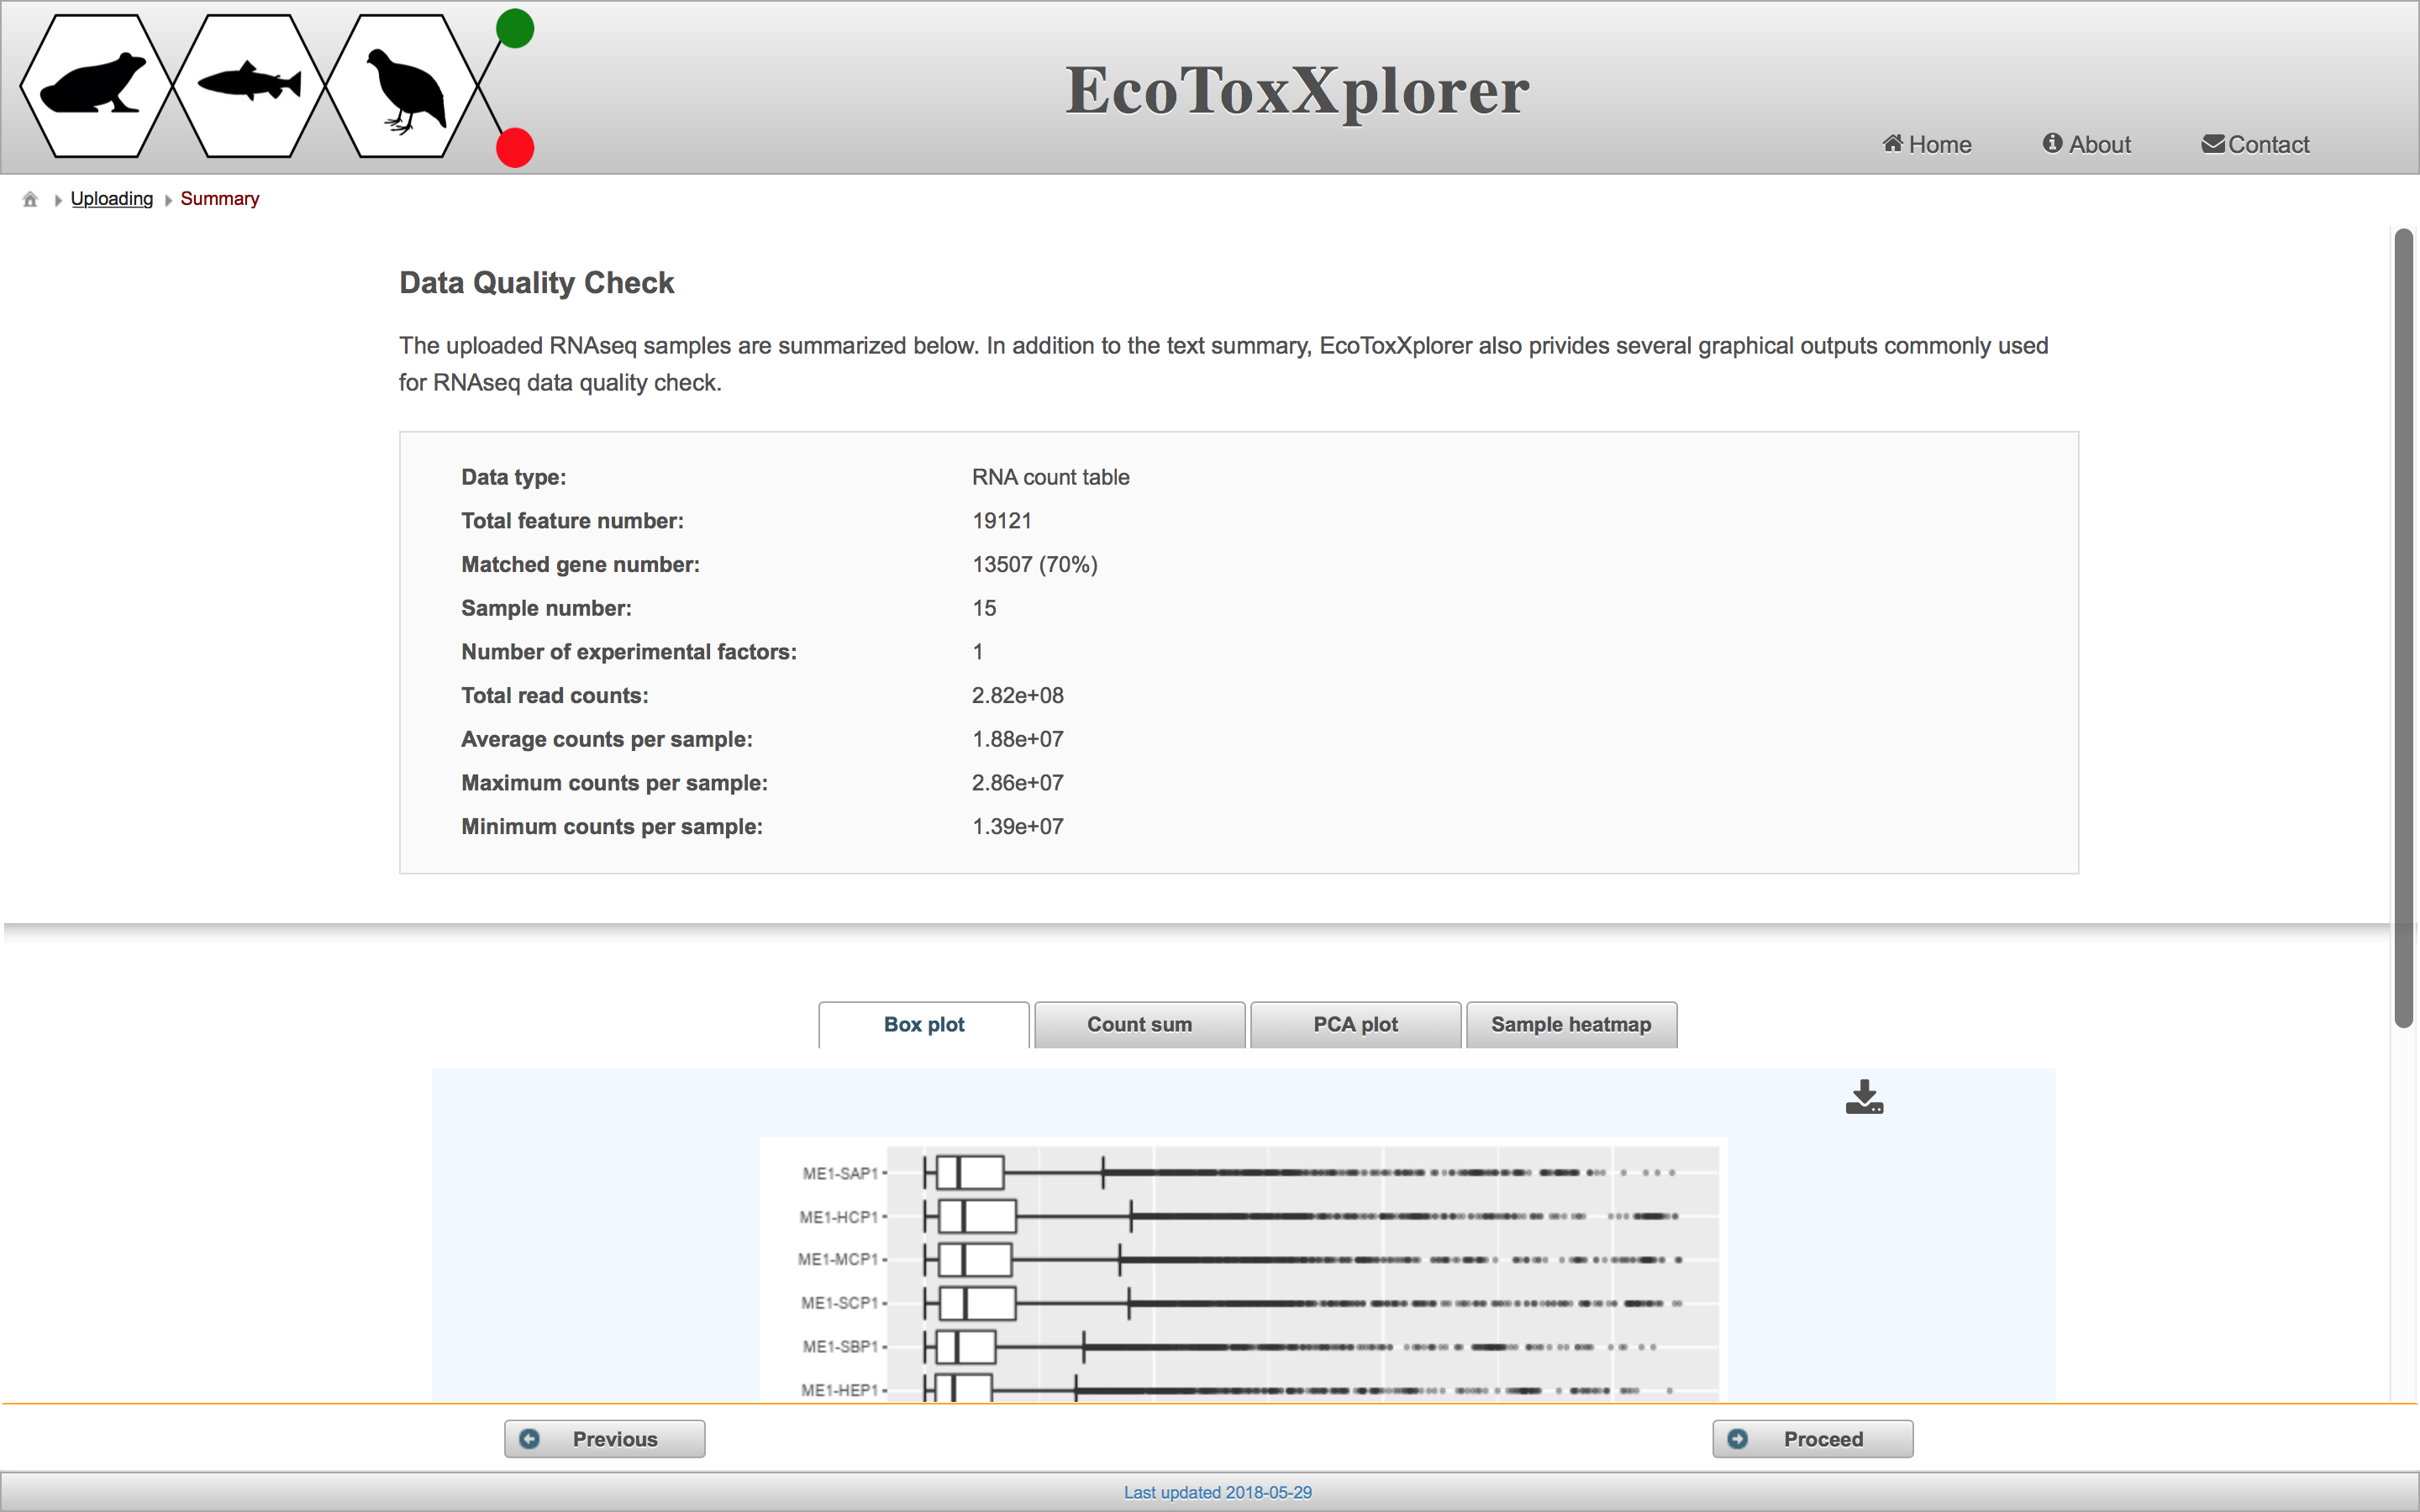
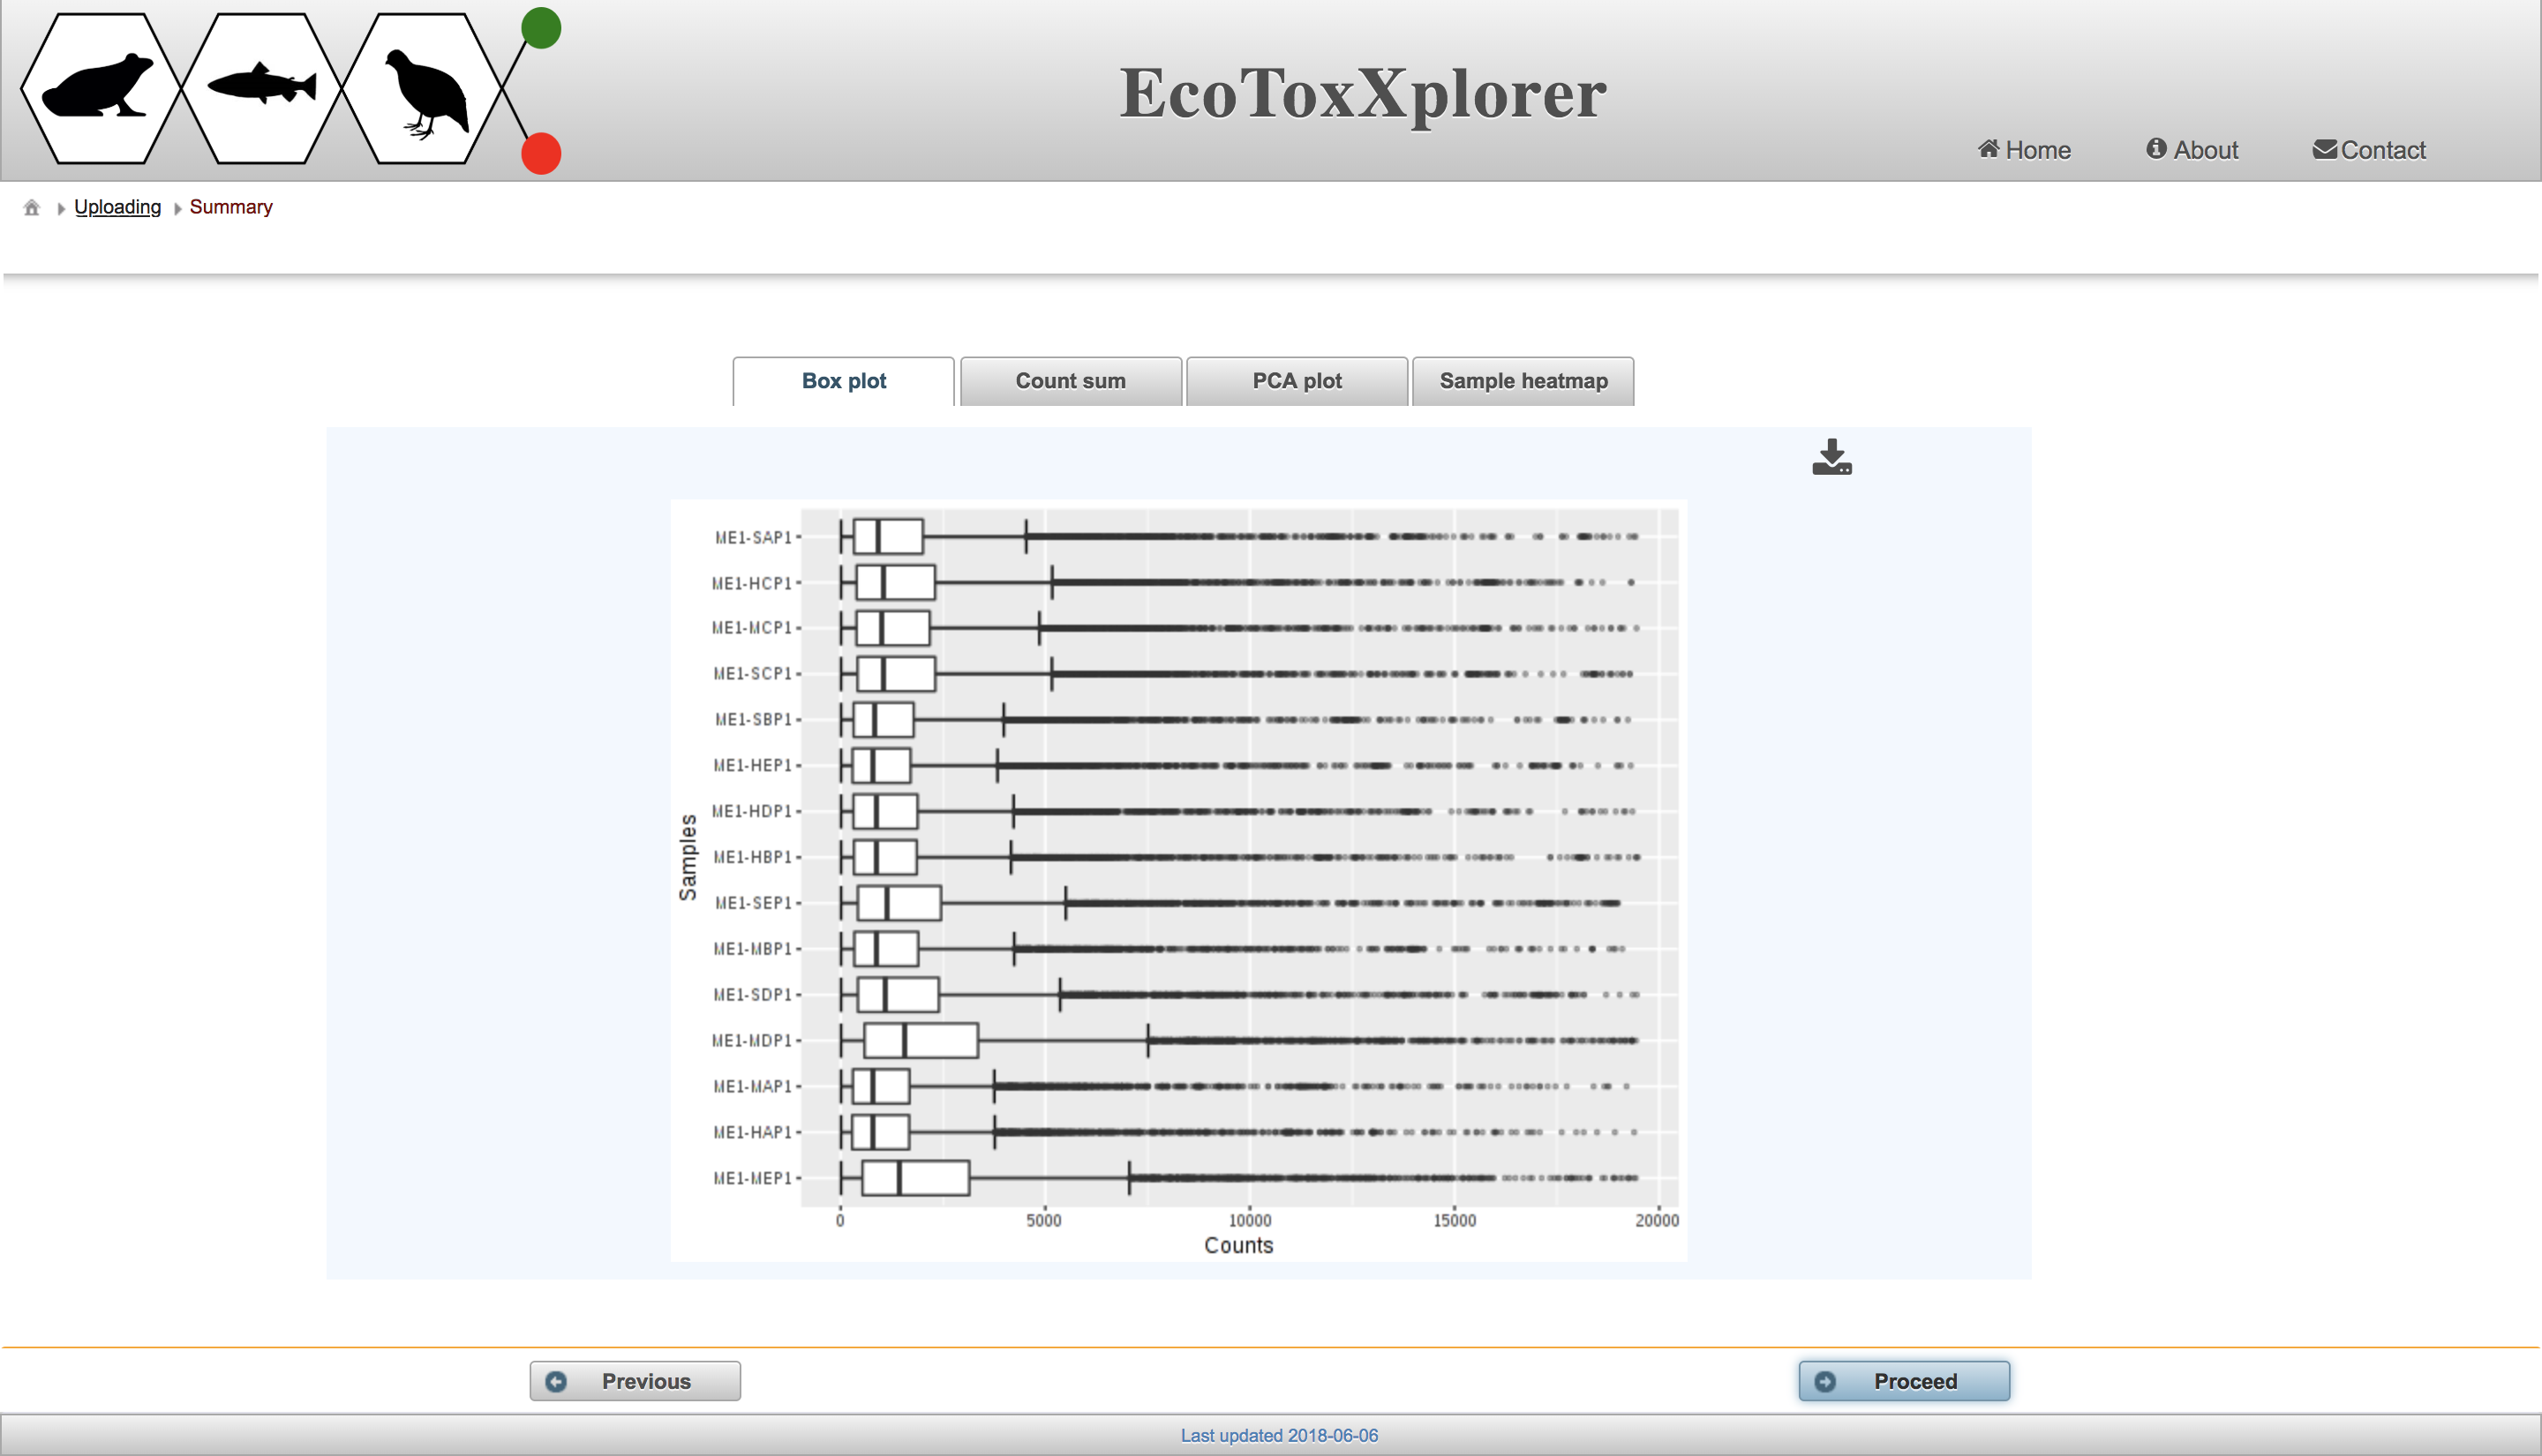
After uploading the data, the Xplorer brings users to a data quality check page that provides summary information on the samples, experimental design, counts, and gene annotation success, as well as standard visualization of data quality. Prior to conducting any kind of data analysis in transcriptomics, it is important to assess the overall data quality and to see if there are any obvious outliers. The Xplorer makes it easy for users to quickly visualize and understand the quality of their raw data. After uploading the example data, the following should appear on your screen:

You can browse through different visualizations of the raw data by clicking on the buttons below the summary table. When you are finished, click the “Proceed” button to move on to filtering and normalization.
